
The following report by Jonathan Lesser was originally published at the National Center for Energy Analytics. You can view the original publication here.
Executive Summary
There is a deep problem with one of the core concepts in the rationale for regulating carbon dioxide. It’s called the “social cost of carbon” (SCC). As a concept, SCC has some theoretical merit. However, it should not be used for making energy policy choices. The SCC can vary by orders of magnitude, depending on the research model. Moreover, it is often divorced from underlying scientific or economic principles, reflecting instead the assumptions and preferences of the modelers. Yet the SCC is used to justify staggeringly expensive regulations and mandates.
Set aside the ongoing debate over the underlying science of climate change. In order to justify incurring costs today by regulating the emissions of carbon dioxide and other greenhouse gases, climate modelers must make estimates of future economic costs from a range of predicted adverse effects that will theoretically occur over the next three centuries. The two largest predicted costs arise from estimated reductions in agricultural production and increased incidences of tropical diseases. Other predicted adverse impacts include the costs of combating rising sea levels, species losses, and losses of forests and wetlands, among others. All require the assignment of an economic cost.
Hence researchers, primarily economists, developed the concept of a social cost of carbon to estimate future costs from hypothesized and modeled effects of rising carbon emissions. But as this report shows, the SCC is an arbitrary metric. Moreover, using the SCC to justify energy and environmental policies, such as multibillion-dollar subsidies for green energy resources, renewable energy mandates, and forced electrification of vehicles and heating systems, leads directly to higher energy costs and reductions in well-being. For example, studies purporting to validate the cost-effectiveness of offshore wind projects in New Jersey show that more than half the economic “benefits” come from the SCC, justifying a project that would deliver electricity at over a threefold higher cost than today’s average wholesale market prices. In 2024, the U.S. Environmental Protection Agency (EPA) used the SCC to justify significant increases in vehicle mileage standards, which would result in a de facto electric vehicle mandate.
Estimating SCC values requires numerous assumptions, many of which are arbitrary. The most consequential assumption for all SCC estimates is the so-called discount rate, which is, in effect, a measurement of the value of a dollar today compared with what the dollar might be worth in the distant future. Tinkering with discount rates can justify spending a lot of money today to avoid (again, theoretical) future costs.
A 2010 report provided the first official U.S. government values of the SCC to be used by federal agencies. The recommended values were about $43 per metric ton (tonne) of carbon emissions in 2025 (in today’s dollars), rising to about $65 per tonne in 2025 (again, in today’s dollars). The estimates were revised over time and generally rose slightly. Then, in late 2023, the EPA released updated SCC values that were far higher: $255 per tonne in 2025 and $370 per tonne in 2050 (in today’s dollars). The agency also reported estimates up through 2080—$490 per tonne in that year. If those newest SCC values were imposed as a carbon tax—which many propose, whether direct or indirect—it would be equivalent to adding $2.27 to the cost of a gallon of gasoline today and $4.35 to each gallon in 2080.
The huge jump in SCC values stems primarily from two factors: the new estimates are based on forecasts that extend 300 or more years into the future, rather than a “mere” century; and lower discount rates, which cause predicted damages in future centuries to be weighed far more heavily in the present.
There are fundamental problems with this new approach. Given historical rates of technological progress, accurately predicting, i.e., modeling and pricing, the state of the world 300 years from now is as silly as someone in 1725 predicting our world today.
In addition, the arbitrary choice of a discount rate is essentially a reflection of the SCC modelers’ judgement about weighing the well-being of future generations against that of people today.
The new, larger SCC estimates are being used by states and, at this writing, by the federal government to justify adopting de-carbonization policies, including vehicle mileage standards, electric vehicle subsidies or mandates, and offshore wind mandates with above-market contract pricing, as well as bans on such things as domestic heating with natural gas. In short, the SCC is used to justify far higher energy costs today. Furthermore, the economic and environmental damages caused by de-carbonization policies (e.g., loss of agricultural lands and species losses) are typically ignored by SCC advocates.
Notably, the rationale for an SCC to reduce CO2 emissions takes place in a world where the U.S. accounts for less than 15% of global emissions. That percentage will continue to decrease because the increase in emissions from developing countries, especially China and India, will dwarf any U.S. reductions and not change the fact of a future with higher overall emissions, regardless of the U.S. impoverishing its citizens today. Using SCC estimates to drive domestic energy policies amounts to all pain and no gain.
Introduction
The costs and benefits of investments in energy infrastructure, as well as the energy policies that influence those investments, reflect numerous trade-offs. Some trade-offs directly reflect different projects’ costs and their expected performance. Others focus on indirect impacts, such as the effects of siting offshore wind (OSW) facilities on local tourism or commercial and recreational fishing. And nonmarket costs and benefits should be considered—primarily environmental ones such as emissions of air and water pollutants and potential impacts on endangered species. Most recently, the costs associated with carbon dioxide (CO2) emissions and other greenhouse gases (GHGs), most of which result from the combustion of fossil fuels, have taken center stage in energy policy and infrastructure evaluations.
Economists incorporate nonmarket costs and benefits (often called “external” costs and benefits because they are external to well-defined markets) to more accurately reflect the total costs and benefits to society as a whole (“social” costs and benefits). By doing so, society (in theory) can allocate scarce resources more efficiently, thus improving overall well-being.
Over the past 20 years, estimates of the costs of GHG emissions, the “social cost of carbon” (SCC), have been incorporated into federal and state-level energy policies. These policies range from emissions regulations for power plants and internal combustion vehicles, developed by the U.S. Environmental Protection Agency (EPA), to individual states mandating electric vehicles and renewable energy projects, as well as state and federal subsidies. The SCC has also led to a huge academic research industry. A recent Google Scholar search returned more than 22,000 academic journal articles on the subject.
Most estimates of the SCC have been developed using Integrated Assessment Models (IAMs), often developed by teams of researchers. Another source of estimates has been expert elicitations, called a “Delphi” approach.[i] Of course, the SCC values reported by these “experts” may also be based on values estimated from IAMs.
SCC estimates vary widely, from values below $0 (meaning that additional carbon emissions are beneficial) to costs approaching $1,000 per metric ton. This wide range of values is a consequence of differences in how different IAMs work and different assumptions about fundamental parameters that cannot be observed. This uncertainty renders SCC estimates of little use when performing benefit-cost analyses of alternative energy policies, except as a way of influencing the outcomes of those analyses. Moreover, because the SCC reflects global costs (or benefits), its use creates important distributional impacts for U.S. energy consumers who are forced to pay higher energy prices for using green energy resources that emit no CO2 but receive almost no benefits from any realized emissions reductions.
Proponents of green energy policies (e.g., mandates to require all new vehicles sold to be electric, bans on natural gas hookups in new buildings, and installing OSW and solar power projects) favor using higher estimates of the SCC, which can bolster their preferred policies that would otherwise fail a benefit-cost test. Opponents of using the SCC believe that it is a thumb on the benefit-cost scale that unfairly harms domestic consumers by raising energy costs and reducing economic growth. Opponents also point out that federal cost-benefit analyses are supposed to consider only benefits and costs accruing to U.S. residents, rather than worldwide benefits. Moreover, because climate change is a global issue,[ii] most of the estimated benefits of avoided carbon emissions accrue outside the United States. I.e., U.S. consumers bear all the costs of domestic carbon-reduction policies but receive few of the benefits.
The trend toward larger SCC estimates has become a key factor driving energy policy decisions, by increasing the benefit side of the cost-benefit ledger: policies and investments that would otherwise be rejected because their monetary costs exceed their monetary benefits (e.g., higher energy costs for U.S. consumers) can be justified under a cost-benefit framework by adopting a high-enough SCC estimate.
A recent example: Resources for the Future (RFF), a Washington, D.C., think tank, estimated the costs and benefits of installing approximately 35,000 megawatts (MW) of OSW generation along the Atlantic and Gulf Coasts.[iii] The analysis found that OSW would provide $9.2 billion in inflation-adjusted 2020 dollars (2020$) of CO2 reduction benefits as of 2035, equivalent to $60 per megawatt-hour (MWh), based on RFF’s $185 per metric ton (2020$) estimate of the SCC.[iv] By comparison, the average wholesale price of electricity in New England in 2024 was around $35/MWh. Hence, based on the RFF analysis, the benefits from reducing future carbon emissions are almost twice as large as the market price of electricity in New England, which is set in most hours by the cost of natural gas-fired generation.
In addition to the broad range of SCC estimates, the second fundamental problem with using an SCC in cost-benefit studies is that those estimates are based on models whose most important inputs—those having the greatest impacts on the estimates—are unobservable. Instead, those inputs, including the sensitivity of world temperatures to changes in carbon emissions[v]—variables that determine the relationships between increased atmospheric CO2 concentrations and how future damage costs are converted to present-day dollars—are selected by the modelers themselves.[vi]
Recent estimates, including those made by RFF, are based on predictions that extend 300 years into the future, and some models extend their analysis to 3000. (Previous estimates generally extended only to 2100.) Given rates of technological progress, we are as likely to accurately predict the next 300 years as someone living in 1725 (George Washington was born in 1732) could predict the world’s technologies today. To claim that we can accurately forecast 1,000 years into the future is delusional.
This report argues that the numerous uncertainties and arbitrary nature of key inputs to the models used to calculate SCC values mean that estimates of the value of avoided GHGs should be excluded from cost-benefit analyses of energy and environmental policies.[vii] Otherwise, such analyses can become exercises in deciding a desired outcome and then selecting SCC values that ensure that it passes benefit-cost muster.
Instead of relying on SCC estimates to determine energy policies, a better approach is to emphasize access to ample supplies of clean, reliable, and affordable energy, beginning especially with natural gas as the country moves toward a much greater use of nuclear power. That will improve societal well-being. Arbitrary federal and state government mandates to use unreliable, high-cost technologies, on the other hand, reduces societal well-being. Consequently, governments should focus on funding basic research toward developing technologies that provide reliable clean energy supplies, such as new nuclear technologies, while eliminating regulations, such as new design permitting, that increase the cost of commercializing those technologies.
Integrated Assessment Models: How They Work and Their Key Assumptions
Integrated Assessment Models (IAMs) are complex computer models that combine projections about future changes in world temperatures stemming from increased GHG emissions with projections of the future impacts of those higher temperatures and their projected costs. These costs include impacts on human health, changes in agricultural productivity, and the costs of mitigating certain types of damages, such as the costs of building higher seawalls to limit damages from rising sea levels. More complex models also examine distributional impacts, such as the impacts on developing nations versus developed ones. Some models build up SCC estimates from individual types of damages; others take a top-down approach that posits a single worldwide damage function encompassing the breadth of projected climate-change impacts.
Although economists have developed numerous ways to estimate nonmarket costs (e.g., external costs such as pollution and the loss of endangered species), it is not an exact science. Moreover, many environmentalists object even to assigning dollar values to these impacts. For example, how can one place a dollar value on the extinction of a species of whale or the cost of a child becoming afflicted with asthma?
Another controversial issue is how to weigh the well-being of future generations against that of the present generation. That controversy underlies the discount rates that IAMs use to convert future damage costs into current dollars. As I discuss later in this report, the choice of a discount rate is the largest single factor affecting SCC estimates. The combination of extending analyses out three centuries or longer, and then using lower discount rates to convert future damages into current dollars, has resulted in updated SCC values that are almost 400% higher than previous estimates. Whereas the first official estimates by the U.S. government were about $50 per metric ton in 2025 (in today’s dollars),[i] the more recent estimates are almost $200 per tonne (in today’s dollars).[ii]
Without delving into the philosophical issues that surround valuing nonmarket costs and discounting future costs and benefits,[iii] the reason for placing monetary values on such impacts is that individuals and whole societies must decide how to allocate scarce resources. Although monetary estimates of nonmarket impacts are imperfect, they are better than nothing.
However, the usefulness of incorporating cost estimates of nonmarket impacts into energy infrastructure decisions depends on the uncertainty surrounding those estimates. If infrastructure decisions hinge on small differences in those nonmarket cost estimates, but we have no real idea what the true costs are, then incorporating a specific nonmarket cost estimate becomes arbitrary.
As this report demonstrates, the uncertainty and arbitrariness of key assumptions lie at the heart of why SCC estimates should be excluded when making informed choices about energy infrastructure. Instead, SCC estimates are being used as a thumb on the scale to bias decisions toward policymakers’ preferred outcomes, to the detriment of society at large. This does not mean that climate change is imaginary or that a changing climate does not impose costs (and benefits) on society and nature. Instead, it means that policymakers should abandon SCC estimates and base energy infrastructure decisions on more credible and unbiased grounds.
IAM Structure
Although numerous IAMs have been developed,[i] U.S. policymakers have employed SCC estimates based on three primary models: (i) Dynamic Integrated Climate and Economy (DICE); (ii) Framework for Uncertainty, Negotiation and Distribution (FUND); and (iii) Policy Analysis of Greenhouse Effect (PAGE). More recently, the Greenhouse Gas Impact Value Estimator (GIVE) model was developed.[ii] That model appears to closely follow the structure of the FUND model. Of these different IAMs, the FUND model is the most detailed. It breaks the world into 16 separate regions and develops bottom-up estimates of damages associated with changes in agricultural production, health impacts (e.g., deaths from tropical diseases, heart attacks from hot and cold weather), changes in forest cover, loss of water resources, and even extreme weather.[iii]
As discussed in more detail below, IAMs contain numerous assumptions, many of which are based solely on modelers’ beliefs, such as the sensitivity of agricultural production to changes in temperature and the ability of farmers to adapt to changes in temperature.[iv] The general structure of these IAMs is shown below (see Figure 1). The two topmost items—the Socioeconomics Module and Emissions Module—are typically exogenous to the models: they are developed independently and then used to calculate future damages from GHG emissions. Thus, the Socioeconomics Module provides forecasts of future world population and economic well-being, as measured by gross domestic product (GDP) and resulting GHG emissions. The rationale is that, as population and wealth increase, so will GHG emissions, which are embedded in the Emissions Module. The increase in emissions is then translated into impact on temperatures, sea levels, and atmospheric CO2 concentrations through the Climate Module, which feeds into the Damages Module. Those damages are then monetized and discounted back to the present day using the Discounting Module. (Some models include non-monetized damages, too.)
Figure 1. General Structure of an Integrated Assessment Model
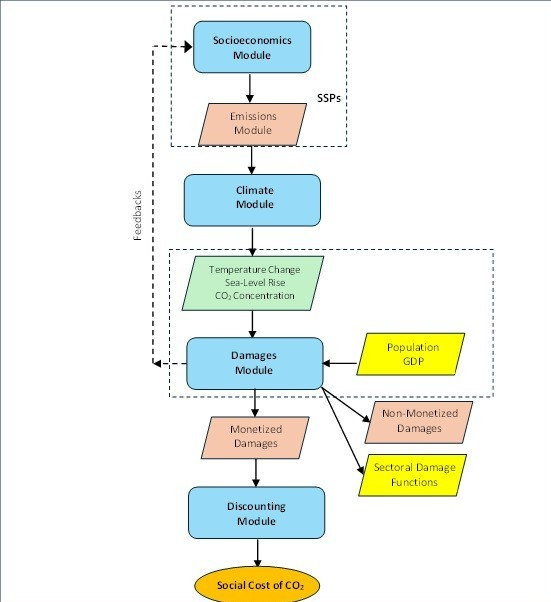
Valuing Climate Damages: Updating Estimation of the Social Costs of Carbon Dioxide
(Washington, D.C.: National Academies Press, 2017)
The scenarios used by IAMs are called Shared Socioeconomic Pathways (SSPs).[i] The socioeconomic scenarios that have been developed by the Intergovernmental Panel on Climate Change (IPCC) in its reports extend through 2100. Most of these scenarios were first developed at Stanford University in the 1990s.[ii] However, the most recent estimates of SCC are based on predictions extending 300 or more years into the future. Therefore, these socioeconomic forecasts must be extended. The FUND model, for example, uses the population and income forecasts from these scenarios and extrapolates them through 2300.[iii] Again, this is an arbitrary and absurdly long time frame that is essentially impossible to use with any meaningful accuracy.
Each scenario is based on various combinations of population growth, income and economic growth, energy consumption, and carbon emissions. The scenarios include an assumed “business as usual” case, from which SCC is derived based on the cost of mitigating the modeled climate impacts of that scenario. Importantly, the forecasts are exogenous to the IAMs: they are based on hypothesized forecasts of future economic growth, population, technology, and resulting GHG emissions.[iv] One controversy has been the use by many researchers of a specific SSP, the “Representative Concentration Pathway” (RCP) 8.5, which posits an extreme future that assumes rapid population growth, accompanied by rapid increases in fossil fuel consumption and a global temperature increase over 5⁰C by 2100.[v]
A fundamental issue with all the various SSPs, including RCP 8.5, is that there are no probabilities assigned to them; climate researchers posit these scenarios but do not assign any likelihood of their occurrence. (In fact, the probability that any given scenario’s multiple assumptions, many of which are codependent, will be realized is near zero.)[vi]
The next step is calculating the impact of forecast GHG emissions from the various scenarios on world temperature,[vii] known as “climate sensitivity,” which is defined as the temperature increase that would eventually result from a doubling of the atmospheric concentration of CO2-equivalent GHGs (CO2e).[viii]
The emissions that determine the concentrations of GHGs are based on exogenous scenarios—they are inputs to the IAMs. For example, the FUND model estimates future CO2 emissions as a function of four factors: (1) the carbon intensity of energy use over time (the amount of CO2 emitted per unit of energy consumption); (2) the energy intensity of the economy over time, measured as energy consumption per dollar of GDP; (3) GDP per capita; and (4) population.[ix] The parameters that determine carbon intensity and energy intensity of the economy through 2300 for each region are guesses based on extrapolations of historical data.[x] Assumptions about the quantities of methane and nitrous oxide are based on assumptions from the first IPCC report in 1992 and extrapolated through 2300.[xi] The DICE model uses a somewhat similar approach to estimate future GHG emissions from industrial sources and land-use emissions. For both, baseline emissions are a function of total output, emissions intensity per unit of output, and emissions controls.[xii]
On top of the arbitrary assumptions about future energy intensity and carbon intensity, the sensitivity of world temperature to changes in GHG concentrations is unknown, and different IAMs make different assumptions about the relationship between GHG concentration and temperature changes. The key parameter in these relationships is climate sensitivity. For example, the FUND model assumes a base case in which a doubling of GHG concentration results in a temperature increase of 3.0°C.[xiii] The DICE model uses a different framework, calibrated to the results of a specific IPCC scenario.[xiv]
Various models have been used to estimate climate sensitivity, but those estimates are subject to much uncertainty, owing to uncertainty over feedback effects—how changes in GHG levels change the impacts of additional GHG emissions.[xv] Moreover, many of these models significantly overestimate historical temperature changes.[xvi] Without feedback effects, an increase in the atmospheric concentration of GHGs is assumed to cause a constant increase in temperature. (That value is not known, either.) But as the atmospheric concentration of GHGs increases, the impacts of additional GHGs change.
Despite assumptions that these feedback effects are reinforcing—that as CO2 concentrations increase so does the rate of temperature increase—there is evidence that as CO2 concentrations increase, the rate of temperature increase slows (i.e., there is negative reinforcement).[xvii]
Another issue is the starting point temperature from which the temperature increases are measured. That starting point is taken to be an estimate of Earth’s preindustrial temperature, which in the DICE and PACE models is assumed to be the optimal temperature. As discussed in more detail below, all increases in world temperature from that preindustrial level are assumed to impose damages. The use of a “preindustrial temperature” raises four key questions: (1) What time period defines preindustrial? (2) How is the preindustrial temperature measured for that time period? (3) What is the basis for assuming that the measured temperature is optimal? and (4) What does “optimal” even mean in that context? If one graphed climate damages versus average world temperature, it would show increasing damages as GHG concentrations fell below a certain level.[xviii] For example, most plants die at CO2 concentrations below 150 parts per million, which would cause all animal life to perish.
There is no specific definition of the preindustrial time period that should be used.[xix] IPCC defines it as 1850–1900; others have used 1720–1800. Both periods coincide with the end of the Little Ice Age, which is believed to have begun in the early 1400s. Yet, before 1850, there were few consistent temperature records, rendering a determination of the world average temperature uncertain.[xx] Hence, estimates of warming since preindustrial times are guesswork. It was not until the 1970s that satellite measurements, which are acknowledged to be the most accurate measurements of atmospheric temperatures, began. Finally, even if one defined the preindustrial period and was able to develop an accurate measure of the average world temperature during that time, it is impossible to define its optimality. The FUND model, which disaggregates the world into 16 subregions, bases damage calculations on preindustrial temperatures in each of those subregions.[xxi] We know little about an average preindustrial world temperature; we know even less about regional variations.
Climate Damages
The heart of all IAM-based estimates of SCC is how those models determine damages related to increased concentrations of GHGs and the resulting impacts from higher temperatures. The projected impacts of higher temperatures include a rising sea level and the resulting expenditures to protect coastal areas, impacts on agricultural production, increases in the number of deaths from tropical diseases, and many other factors, including changes in energy consumption. Providing a comprehensive discussion of how all IAMs estimate all climate-related damages would require a book-length report. Hence, this section provides an overview of the general approaches used to estimate damages and the methods used to estimate the two largest predicted damage categories: reduced agricultural output and increasing death rates from disease.
IAMs approach damage estimates in two ways. The first is a top-down approach that aggregates different types of damages into a single damage estimate that is a function of increased temperatures. The DICE and PAGE models use this approach, although the PAGE model separates damages into economic and noneconomic categories, and the DICE model separates damages associated with a rising sea level and everything else. The second is a bottom-up approach that estimates damages for many different categories, such as health, agriculture, extreme weather, energy consumption, and dryland losses. The FUND model is an example of this second approach; it estimates damages for 14 separate categories.[i]
Top-Down Damage Estimates
Top-down damage models are relatively straightforward because of the simplicity of the assumed damage functions. For example, the DICE model assumes a quadratic damage function, in which total damages are a function of the square of the world temperature increases since Earth’s estimated preindustrial average.[ii] The DICE model estimates damages relative to the reduction in GDP that is projected under a scenario where world temperature is unchanged due to human activities.[iii] The specific damage function is
L(t) = 0.003467 x (Tt – TPI)2,
where L(t) is the relative loss in GDP in year t, Tt is the average world temperature in year t, and TPI is the average preindustrial world temperature. The resulting world GDP in year t is L(t) × GDP*, where GDP* is the exogenously determined GDP in year t, assuming no human-caused temperature increases. For example, a 3°C warming over preindustrial temperatures would reduce GDP in year t by (0.003467) × 3 = 0.014 = 1.4%. The DICE model then adds two other damage components: (1) a 1% loss associated with a tipping point, when the temperature increase is 3°C; and (2) a judgmental loss of 0.5% of GDP to account for other unspecified losses, implying a total loss of about 3.0% of world GDP.[iv]
A different model that was developed by analyzing the results of numerous separate climate damage models (a meta-analysis) assumes this same quadratic form, but the coefficient on the square of the temperature increase is over three times larger.[v] Hence, whereas the DICE model estimates a 3.0% loss of world GDP for 3°C warming, this model estimates damages just under 10% of world GDP.
There are several questionable assumptions in this general damage estimation approach. These models assume that preindustrial temperatures were optimal. Consequently, the models forecast what future GDP would be under those temperatures. Given the inability even to define what the most appropriate preindustrial period is and the uncertainty in measuring the preindustrial world temperature, this optimal temperature scenario is arbitrary. Moreover, forecasting worldwide GDP three or more centuries into the future is subject to so much uncertainty as to be nothing more than arbitrary guesswork.
The assumption of a quadratic loss function based on increasing temperatures over the presumed preindustrial average world temperature is also pure speculation.[vi] There is no economic theory that underlies such a loss function. Moreover, that loss function presumes, without evidence, that increased GHG concentrations can only impart damage. There is no consideration of, say, the well-known fact that plants thrive at higher CO2 concentrations and use water more efficiently.
The parameter in the DICE loss function (the 0.003467 value) is based on a literature review of modeling results.[vii] As for the meta-analysis result, it effectively determines a single, best-fitting model of the many individual ones, including the DICE model. Hence, to the extent that the individual model specifications are arbitrary—they are—so is the meta-analysis result.
Even if one accepts the estimate that GHG-related losses will total about 3% of world GDP for a 3°C warming, that loss must be considered relative to the overall increase in well-being. The base-case results for the DICE model (a 3.0°C increase) show that consumption per capita in 2100 is 360% greater than in 2020 in inflation-adjusted dollars. By 2200, the model results show that per-capita consumption is almost 2,000% higher than in 2020—again, in inflation-adjusted dollars.[viii]
Hence, the overall decreases in consumer well-being from lost GDP are dwarfed by the overall increase in well-being that is forecast to take place regardless. This result has important consequences for policy because it raises a key question: How much should the current generation pay (in the form of a reduced standard of living) to benefit future generations that will be far better off, regardless?
This question of trade-offs between the current generation and presumably better-off future generations is no different from asking whether today’s poorer nations today should be required to make themselves even worse off to benefit wealthier nations. If the answer to the latter question is no, there is no basis for concluding that today’s generation should make itself worse off for future generations that will be better off.
Bottom-Up Damage Estimates
Several models—notably, the FUND and GIVE models—disaggregate damages into specific categories. The FUND model provides the most disaggregated damage estimates, including health-related damages, agricultural losses, water losses, reductions in the amount and value of forested lands, changes in energy consumption for heating and cooling, damages from sea-level rise, damages to ecosystems, and damages from extreme weather. These damages are estimated at least 300 years into the future; the FUND model develops estimates based on projections through 3000.
Previous analyses using the FUND model found that increased energy consumption accounted for the overwhelming majority of estimated climate damages.[ix] More recent estimates, such as those using the GIVE model, find that the largest SCC components are health-related (additional deaths and illness) and agricultural damages.[x]
Agriculture
The FUND model evaluates three types of agricultural impacts. The first assumes that farmers cannot fully adapt to changes in average temperatures. Hence, the more rapidly that temperatures increase, the greater the loss of agricultural production.[i] How quickly farmers adapt is based on parameters that the FUND model documentation admits are expert guesses. Moreover, there is no empirical definition for complete or partial adaptation.
The second impact relates to the overall increase in temperature since 1990. The change is initially positive; warming temperatures initially increase output until a certain temperature is reached, after which output decreases.
The third type is a CO2 fertilization impact, which is always positive, reflecting the well-known observation that higher CO2 concentrations increase plant growth. Parameters that determine the impacts are different for each of the model’s 16 regions.[ii]
Starting with 1990 as the base year, we can graph the separate impacts on agricultural production in the U.S. for the next 100 years. In Figure 2, the annual average temperature increase is assumed to be 0.03°C. The CO2 fertilization impact is based on actual atmospheric CO2 concentrations for 1990–2024 and projected concentrations thereafter.[iii]
As Figure 2 shows, total agricultural output decreases from current levels just over 40 years into the future (an additional temperature increase of 1.2°C), driven primarily by farmers’ inability to quickly adapt to warmer temperatures since 1990. Interestingly, given the FUND model’s assumptions about adaptation loss, virtually the entire lost production (5.9%) has already taken place. Higher average temperatures initially increase agricultural production for the first 45 years, after which production declines and CO2 fertilization is assumed to increase production by about 5% between 1990 and 2090.
Figure 2. U.S. Agricultural Output Impacts: FUND Model

Slight changes to those parameters result in large changes in agricultural output; consider the results if farmers are able to adapt to small annual temperature changes. As Figure 3 shows, increasing the speed at which U.S. farmers adapt to an annual temperature increase of 0.03°C[i] results in increased agricultural production for 80 years into the future versus the 40-year time frame that the FUND model adaptation parameter assumes. The main point is that changes in agricultural output over time depend on numerous factors that, except for the impacts of CO2 fertilization on plant growth, are unknown and probably unknowable.
Figure 3. Effects of Changing the FUND Model Adaptation Speed Parameter on U.S. Agricultural Production

The GIVE model uses a different approach to estimate agricultural damages, based on another meta-analysis.[i] However, a recent article found that, when previously omitted data were included, the projected decreases in crop yields of the previous studies were erroneous.[ii] Thus, rather than the loss of agricultural output being a significant driver of emissions-related economic losses that make up the SCC, those losses become negligible.
Health-Related Damages
The FUND model provides the most detailed breakdown of damages to human health brought about by a rising global temperature. The model incorporates three separate categories: diarrhea-related diseases (e.g., dysentery); tropical diseases transmitted by insects (vector-borne diseases), specifically malaria, schistosomiasis, and dengue fever; and cardiovascular disease (heart attacks, stroke, etc.). Besides estimating changes in mortality, the FUND model estimates increased nonfatal disease rates, called morbidity. For both, the model uses estimates of the statistical value of life to estimate health-related costs.[i]
Rather than break down climate change-related mortality as the FUND model does, the GIVE model uses a model that estimates the overall changes in mortality from all causes, linking these to changes in temperature.[ii] Offsetting the projected increases in mortality rates because of higher temperatures, both models assume that mortality rates decrease as incomes increase. Neither approach attempts to incorporate other technological changes (such as discoveries of new medicines, vaccines, and technologies) that can reduce (and have reduced in the past) mortality rates from specific diseases.
Mortality rates are lower in higher-income countries than in lower-income ones for a variety of reasons, including greater availability of clean water, refrigeration, and health facilities, to name a few. As incomes rise, more individuals will gain access to those resources, which will reduce mortality rates. However, there will also likely be technological advances in how diseases are treated. Three hundred years ago, medicine was primitive; the most common treatment for diseases was bleeding and cupping. The advances that we take for granted now—from antibiotics to MRI machines—had not even been conceived. Presumably, the medical professionals three centuries from now will look back at the current state-of-the-art and wonder at its primitiveness.
The GIVE model’s health damage results are an order of magnitude greater than the FUND model’s results. For example, that model estimates an additional 73 deaths per 100,000 in 2100 under the unrealistic RCP 8.5 scenario. Based on that scenario’s projected world population of 12 billion in 2100, an additional 8.8 million people will die from climate change-related causes. Under a more realistic scenario (RCP 4.5), which assumes some adaptation to warmer temperatures, additional deaths are just 11 per 100,000, implying an additional 1.3 million deaths.
Discounting Future Costs
Because the damages estimated by IAMs from GHG emissions are projected to have centuries-long impacts, future damages must be converted into present-day dollars to estimate the SCC. How this is done is called “discounting.”
The discount rates used in IAMs are the single most important variable affecting SCC estimates. For example, a discount rate of 7% was the assumed opportunity cost of capital and discount rate recommended by the Office of Management and Budget (OMB) in 1992 for benefit-cost analyses of U.S. government programs.[i] Thus, a $1 billion cost incurred 300 years from today would have a present value of $1.53. But at a discount rate of 3%, which was OMB’s estimate of the social rate of time preference (the measure of societal impatience), the present value would be over $141,000, almost 100,000 times larger. (OMB’s 2023 guidelines require a 2.0% discount rate for most government programs.)[ii]
The discount rate represents the time value of money and is commonly applied in cost-benefit and financial analyses in which costs and benefits accrue over time. Doing so enables those costs and benefits to be compared on an equivalent basis. For example, an individual will prefer receiving $1,000 today rather than 10 years from now; he values $1,000 today more than $1,000 10 years from now. How much more depends on that individual’s implicit discount rate. The greater an individual’s implied discount rate, the lower he will value a future payment relative to a payment today.
From the standpoint of investments today that provide returns in the future, discounting is a matter of overall economic efficiency and the opportunity cost of capital (i.e., investments today that provide a return on capital in the future). For example, a business contemplating investing in a new machine today would do so if the expected returns provided by that machine are greater than other alternatives. To the extent that a government makes investments with returns less than the opportunity cost of capital, overall well-being decreases because the monies invested could be used elsewhere to earn a higher return.[iii]
There is little controversy in using discount rates to evaluate private investments to increase economic efficiency and well-being; but in the context of climate change, economic efficiency arguments become enmeshed in arguments about intergenerational equity and fairness, as well as risk aversion. These arguments also hinge on the “social rate of time preference,” which can be thought of as society’s overall rate of impatience: society’s willingness to trade off current consumption for future consumption.[iv]
There is no agreement as to how estimates of future climate-related damages should be discounted back to the present. First, questions of equity and fairness can affect discount rates. For example, is it equitable to value damages to future generations less than damages to the present one? A related equity question is future wealth. If, as most believe, future generations will be wealthier than current ones, should today’s generation be forced to reduce its wealth so that future generations will be even wealthier? Second, the opportunity cost of capital can change over time, and different countries can have markedly different observed returns on investment. As the SCC is supposed to reflect global damages, this raises the question as to what opportunity cost rate is appropriate, if any.
The most common approach to discounting estimates of future climate-related damages is based on the “Ramsey rule,” named after British polymath Frank Ramsey.[v] The Ramsey rule states that the discount rate is the sum of two components: the social rate of time preference plus the future growth rate in the economy multiplied by the rate at which the value of additional consumption decreases (the “elasticity of marginal utility”).[vi] Mathematically, this is written as r = d + η × g, where r is the discount rate, d is the social rate of time preference, and η is the elasticity of marginal utility.[vii] This last term is also referred to as the aversion to inequality; the larger the value of γ, the greater the aversion to inequality and the more money the wealthy would be willing to give up in exchange for improving the well-being of the poor.
Depending on the choices made for the three parameters d, η, and g, SCC estimates can vary widely. One article found that depending on the choices of these three parameters, the SCC could vary between $0 and $120,000 per tonne[viii] (the authors go on to say that by restricting the values of d and η, the expected SCC is $60 per tonne). A further complication is uncertainty about the future—specifically, the rate of growth. It turns out that uncertainty about future growth rates leads to discount rates that decrease over time.[ix]
Policy Implications
On his first day in office, President Trump issued an executive order (EO), “Unleashing American Energy.” That order dissolved the Interagency Working Group that began under the Obama administration and whose purpose was to develop estimates of SCC for use by the U.S. government in benefit-cost analyses of energy and environmental policies. This new EO asks the EPA to consider eliminating the SCC from its regulatory analyses of proposed policies.[i]
As this report has shown, deriving SCC estimates requires numerous assumptions, many of which are arbitrary, about the far-off future. Those assumptions begin with climate models whose accuracy has been disputed because of an inability to replicate observed temperature changes. IAMs use the outputs of these climate models and specific do-nothing scenarios to estimate the damages associated with increasing CO2e (carbon dioxide–equivalent) emissions. Those damages, in turn, are estimated based on expert guesses about the future centuries from now.
Top-down models like DICE assume a quadratic damage function that has no basis in economic theory; it is an arbitrary choice. Bottom-up models such as FUND and GIVE disaggregate damages into specific categories, calibrate damages to predictions made by climate models, and then extrapolate damages 300 years into the future—and, in the case of the FUND model, a millennium. Just as an individual living 300 (or 1,000) years ago could not predict the technologies that we take for granted today, it is unreasonable to assume that we can accurately predict the future centuries from now. New technologies will surely arise, some of which we may not even imagine today.
Then there is the issue of how to trade off potential damages to future generations against the well-being of the current generation using discount rates. Here again, there is no agreement because those trade-offs are rooted in philosophical issues about equity and fairness. Different societies, to say nothing of individuals, will weigh the present against the future differently. It is not possible to determine a uniformly correct trade-off that would weigh current mitigation costs versus future potential damages.
Another equity issue arises if future generations are likely to be far wealthier than the current generation. How much, if any, should the current generation be required to reduce its well-being so that future generations are even better off? Forcing the current generation to do so is little different from policies, such as electric vehicle subsidies, that effectively force the poor to subsidize the wealthy.
Given scarce resources, still another equity-related issue is the trade-off between expenditures to reduce GHG emissions and expenditures to improve access to electricity, clean water supplies, development of vaccines to combat tropical diseases, and basic infrastructure (roads, sewage treatment facilities, etc.), all of which are necessary to improve the well-being of developing nations.
Countering arguments about future uncertainty and the current generation’s well-being versus future generations are claims that the world may reach a climate tipping point that will wreak environmental, economic, and social devastation.[ii] Although there are speculative claims about reaching tipping points (e.g., the collapse of the Antarctic ice sheet, the end of the Gulf Stream), there is no physical evidence that these events are occurring, nor is there evidence that they will occur.
Under this view, societies should approach climate change as they do other adverse events and purchase insurance (in this case, implementing policies to reduce GHGs) against potential tipping points, just as homeowners protect themselves against catastrophic losses from fires or storms. Some have even argued that, because of the potential for a future climate catastrophe, the SCC could be infinite,[iii] irrespective of equity and fairness issues. Of course, it is impossible to devote infinite resources to address a single issue, much less multiple potential catastrophes (e.g., a civilization-ending asteroid strike or nuclear holocaust). Although we cannot completely rule out potential future catastrophes (of any sort), the reality is that society has limited resources and must make decisions about how best to allocate them. Hence, the question is whether the SCC should be used to inform and influence resource allocation decisions and, if so, how.
One proposal, first advanced by the late Secretary of State George Shultz and Nobel prize-winning economist Gary Becker, is a carbon tax based on SCC. They recommended that the revenues raised be “recycled” back to consumers to minimize economic harm. Although their recommendation was simple in theory, its practicality is doubtful for two reasons. First, the arbitrary nature of SCC estimates means that there is no “correct” tax value. Second, imposing a nationwide carbon tax, even if the U.S. government promised to recycle the revenues, would be politically suicidal because it would still result in higher energy costs. And few would believe that the government would recycle the revenues other than to politically favored constituencies.
Currently, California and Washington State have carbon cap-and-trade programs that price carbon emissions, and New York State intends to implement a similar program. Although these programs create a price on CO2 emissions, they are not the same as a carbon tax. Instead, these programs establish an overall emissions ceiling. Companies can then reduce their emissions or buy emissions allowances to ensure compliance. As the emissions ceiling falls, the price of allowances will tend to rise unless it is less costly to reduce emissions directly. Moreover, the revenues raised by the programs in California and Washington State are not recycled to consumers, as was recommended by Schultz and Becker. Instead, the revenues are allocated by legislators to their pet projects.[iv] Meanwhile, those states’ cap-and-trade programs have raised higher energy prices and imposed real economic harm, especially among the least well-off.
SCC estimates have been used in evaluations of energy policies and projects. In New Jersey, for example, some estimates of the value of avoided carbon emissions have accounted for over 55% of the estimated benefits of OSW projects, which would otherwise fail cost-benefit tests.[v] In a 2024 U.S. Department of Energy rule for more efficient water heaters, it estimated that the benefits of CO2e emissions reductions would exceed $1 billion annually, using much lower estimates of SCC.[vi] Similarly, EPA’s rule on higher mileage standards (which was a de facto mandate for electric vehicles) used the Biden administration’s much higher SCC estimate to claim over $1.6 trillion (2022$) in emissions-reduction benefits using a 2.0% discount rate and $2.8 trillion (2022$) using a 1.5% discount rate.[vii]
Several economic realities must also be confronted in determining how SCC estimates should be used. Global increases in GHG emissions are being driven by China and India (see Figure 4). U.S. energy-related emissions fell by 19% between 2000 and 2023.[viii] (On an inflation-adjusted basis, U.S. energy-related emissions per dollar of GDP fell by 50% over this same period.) In 2023, U.S. emissions accounted for just 13% of world emissions.
Figure 3. Effects of Changing the FUND Model Adaptation Speed Parameter on U.S. Agricultural Production

China’s and India’s focus is on economic development. China alone is permitting hundreds of new coal-fired power plants, which will emit billions of tonnes of CO2. Policies enacted by the U.S. that increase domestic energy costs or force consumers to purchase more costly electric vehicles, install electric heat pumps, and more costly appliances will reduce U.S. economic growth and well-being; they will not change the developing world’s focus on economic growth and improved well-being for its existing residents. Using SCC estimates to justify investments in (and subsidies of) green energy resources, mandatory electrification, and more costly appliances will not change that fact.
Fossil fuels still account for over 80% of total world energy consumption,[i] despite the trillions of dollars spent on green energy resources such as wind and solar, and the world will continue to depend on fossil fuels for the foreseeable future.
Although the development and use of complex models to estimate the SCC may be an interesting academic exercise, this report shows that those estimates are impractical for actual policy analysis. Rather than use arbitrary SCC estimates to justify green energy subsidies and mandates, a better focus for the U.S. would be to prioritize research and development of lower-cost, emissions-free energy, such as nuclear power plants that use standardized designs, geothermal plants, and perhaps ultimately nuclear fusion. Doing so is likely to have a greater long-run impact on GHG emissions. Moreover, that technology can be transferred to developing nations to provide them with the reliable energy supplies that they require for economic growth.